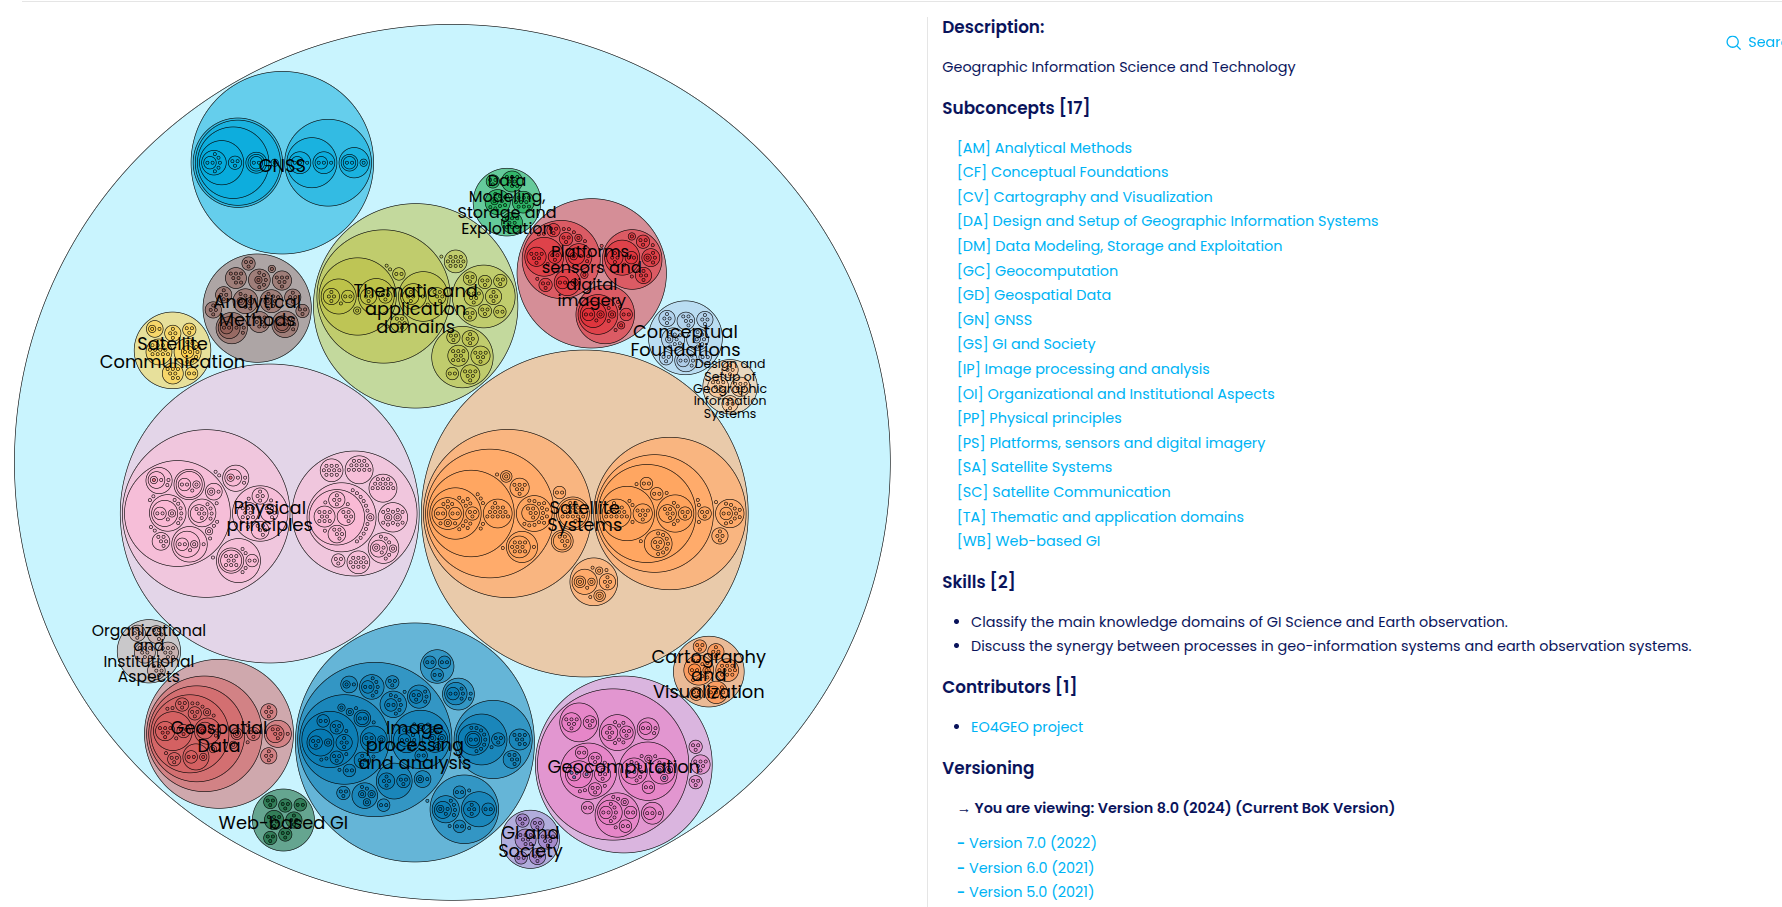
This quick fix is a small data science project that builds a circle tree map using R, while the data wrangling, including impot, tidy and transform, are in Python and R. A circle tree map is a plot that represents hierarchically structured data with the root at the top and the tree unfolding beneath with parent pointing to its children (Nguyen and Huang 2005). An example of a circle tree map is the body of knowledge of GIS by SpaceSUITE.
In this case, the reason to write the post was to share this idea with C., who currently works for EKSH. As he landed to the company, C needed to visualize what were the main focus areas or research fields to better understand the company, find common interest between their colleagues or to find out which area receives greatest attention.
What insights about balance and distribution can a circular treemap uncover in hierarchical data?
For educational purposes, the data of this post are courses I have completed. Therefore, the purpose is to see the balance and distribution of the courses structured in four main childrens, Geographical Information System (GIS), Environmental Sciences (ENV), Languages(LNG) and Biology & Geology (B&G).
Import
Tidy
Transform
Visualize
https://python-graph-gallery.com/circular-packing-several-levels-of-hierarchy/
The package circlepackeR available in R used the nodes and link obtained from the transformation step to a circular tree map.
library(circlepackeR)
circle_certificates <- circlepackeR(
  population,
  size = "value",
  width = "100%",    # Critical: do NOT use numeric width
  height = 400,      # You can adjust this height
  color_min = "hsl(171, 60%, 66%)",
  color_max = "hsl(231, 75%, 11%)"
)
circle_certificates# Save widget as HTML
# htmlwidgets::saveWidget(circle_certificates, "circle.html", selfcontained = TRUE)Falta la tabla
The circular map shows that most courses fall into ENV, GIS, and LNG. In terms of numbers, the LNG area is unbalanced compared to GIS and ENV, since one large circle for a C1 English course (240h) takes up the same space as three smaller GIS courses. A limitation of the circle tree map is that it doesn’t always reflect meaning well, because a GIS course could also relate to ENV, for example when using biodiversity data.
References
Nguyen, Quang Vinh, and Mao Lin Huang. 2005. “EncCon: An Approach to Constructing Interactive Visualization of Large Hierarchical Data.” Information Visualization 4 (1): 1–21. https://doi.org/10.1057/palgrave.ivs.9500087.